


Hurricane disturbance and shifts in forests
Research Questions:
- How do differences in species-level functional traits explain variation in tree mortality, growth, and abundance responses to tropical cyclone (TC) stress?
- How do TC frequency and intensity affect tree responses to TCs via independent effects, or via interactions with trait-performance relationships?
Main Findings:
- Tree species with high maximum height/stature decline in abundance after TCs
- Species with high specific leaf area (SLA, i.e. more “cheap” and acquisitive leaves) increase their growth rates from before to after hurricanes
- Tree mortality decreases nonlinearly with increasing site-level TC frequency, such sites with high yearly cyclone incidence show lower tree mortality rates
- No traits significantly explained mortality responses, and overall traits and tropical cyclone frequency modestly explain demographic responses to TC disturbance (with marginal R2 values ranging from 0.0570 to 0.117).
Publication Under Review:
- Fuentes-Rohwer, T., Mariano, V., Au, T.F., & Umaña, M.N. 2026. A trait-based meta-analysis of tree performance responses to cyclones. Submitted for review with Journal of Biogeography
Ongoing Research:
- Assessing the growth responses of tropical tree species to hurricane and drought disturbance, within the context of the Grime CSR triangle, and linking both tree xylem and stature-related traits to these growth responses.
- Comparing the damage and recovery trajectories of hurricane-impacted forest areas to those impacted by both drought and hurricanes, using the AVOCADO geospatial analysis tool.
Figure 1: conceptual figure illustrating the predicted relationships between the selected functional traits (SLA, maximum height, and WSG), as well as cyclone characteristics (MSW and historical TC frequency) and their effects on tree performance (abundance, growth, and mortality). Red and green arrows indicate negative and positive performance relationships (respectively), and gray arrows outline the general framework of the trait- performance relationships. The green boxes correspond with traits, while the orange boxes correspond with historical, site-level TC characteristics, and the purple boxes show performance outcomes.
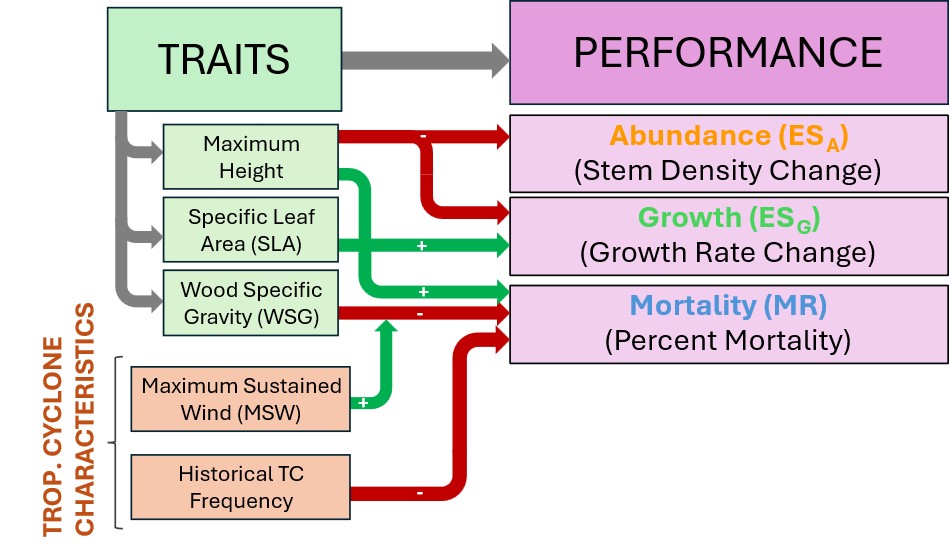
Figure 2: world map showing the locations of each study site. Point colors indicate which performance measures were included in the studies completed at each site. The top left inset map shows the sites within the Northern Atlantic (NA) basin, while the top right inset map shows all sites within the Western Pacific (WP) basin. Areas corresponding with the maximum extent of historical tropical cyclone tracks (since the year 1980) are also shown and color-coded by oceanic basin. The scale bars were each approximated based on equatorial distances and are most accurate for latitudes closest to the equator.
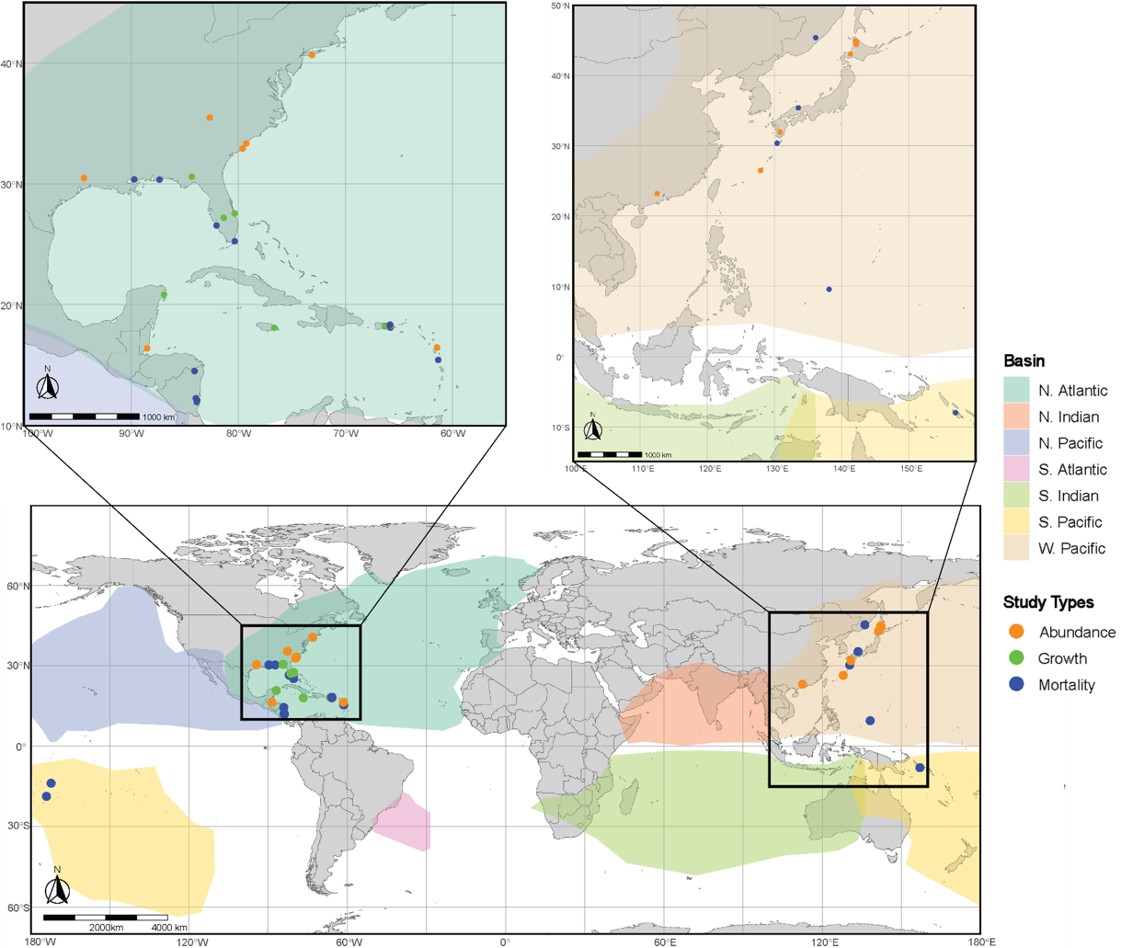
Figure 3: Best-fitting models for mortality (a), growth (b) and abundance (c). Error bars represent the 95% confidence intervals of each mortality rate and effect size. The equation for each best-fitting model, as well as the marginal and conditional R2 values and residual standard deviation (RSD), are included on each graph. Statistically-significant coefficients in each model (alpha = 0.05) are bolded. (Note: in Fig 3a, the predicted baseline mortality rate for non-TC-prone tropical forests in 2050 is included as the lighter-blue dashed line (per McDowell et al., 2018)).
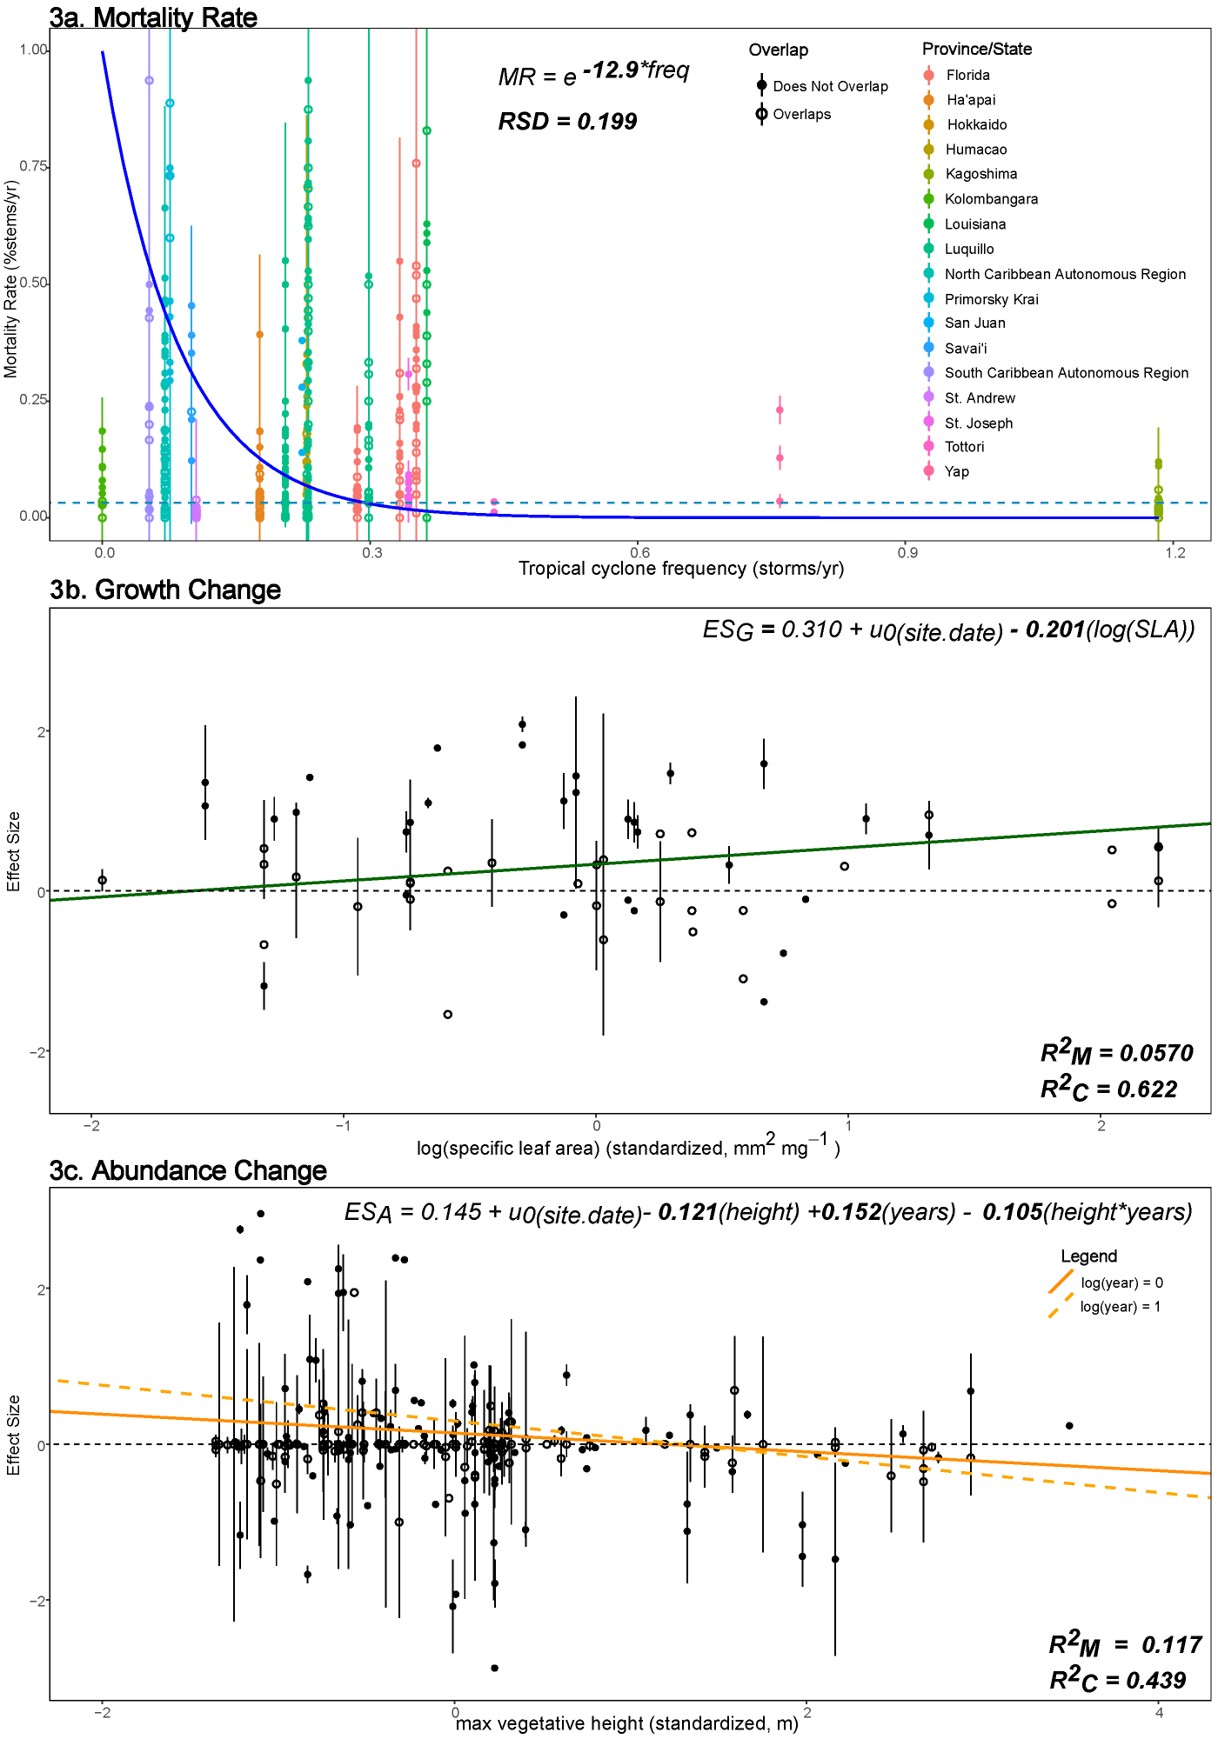
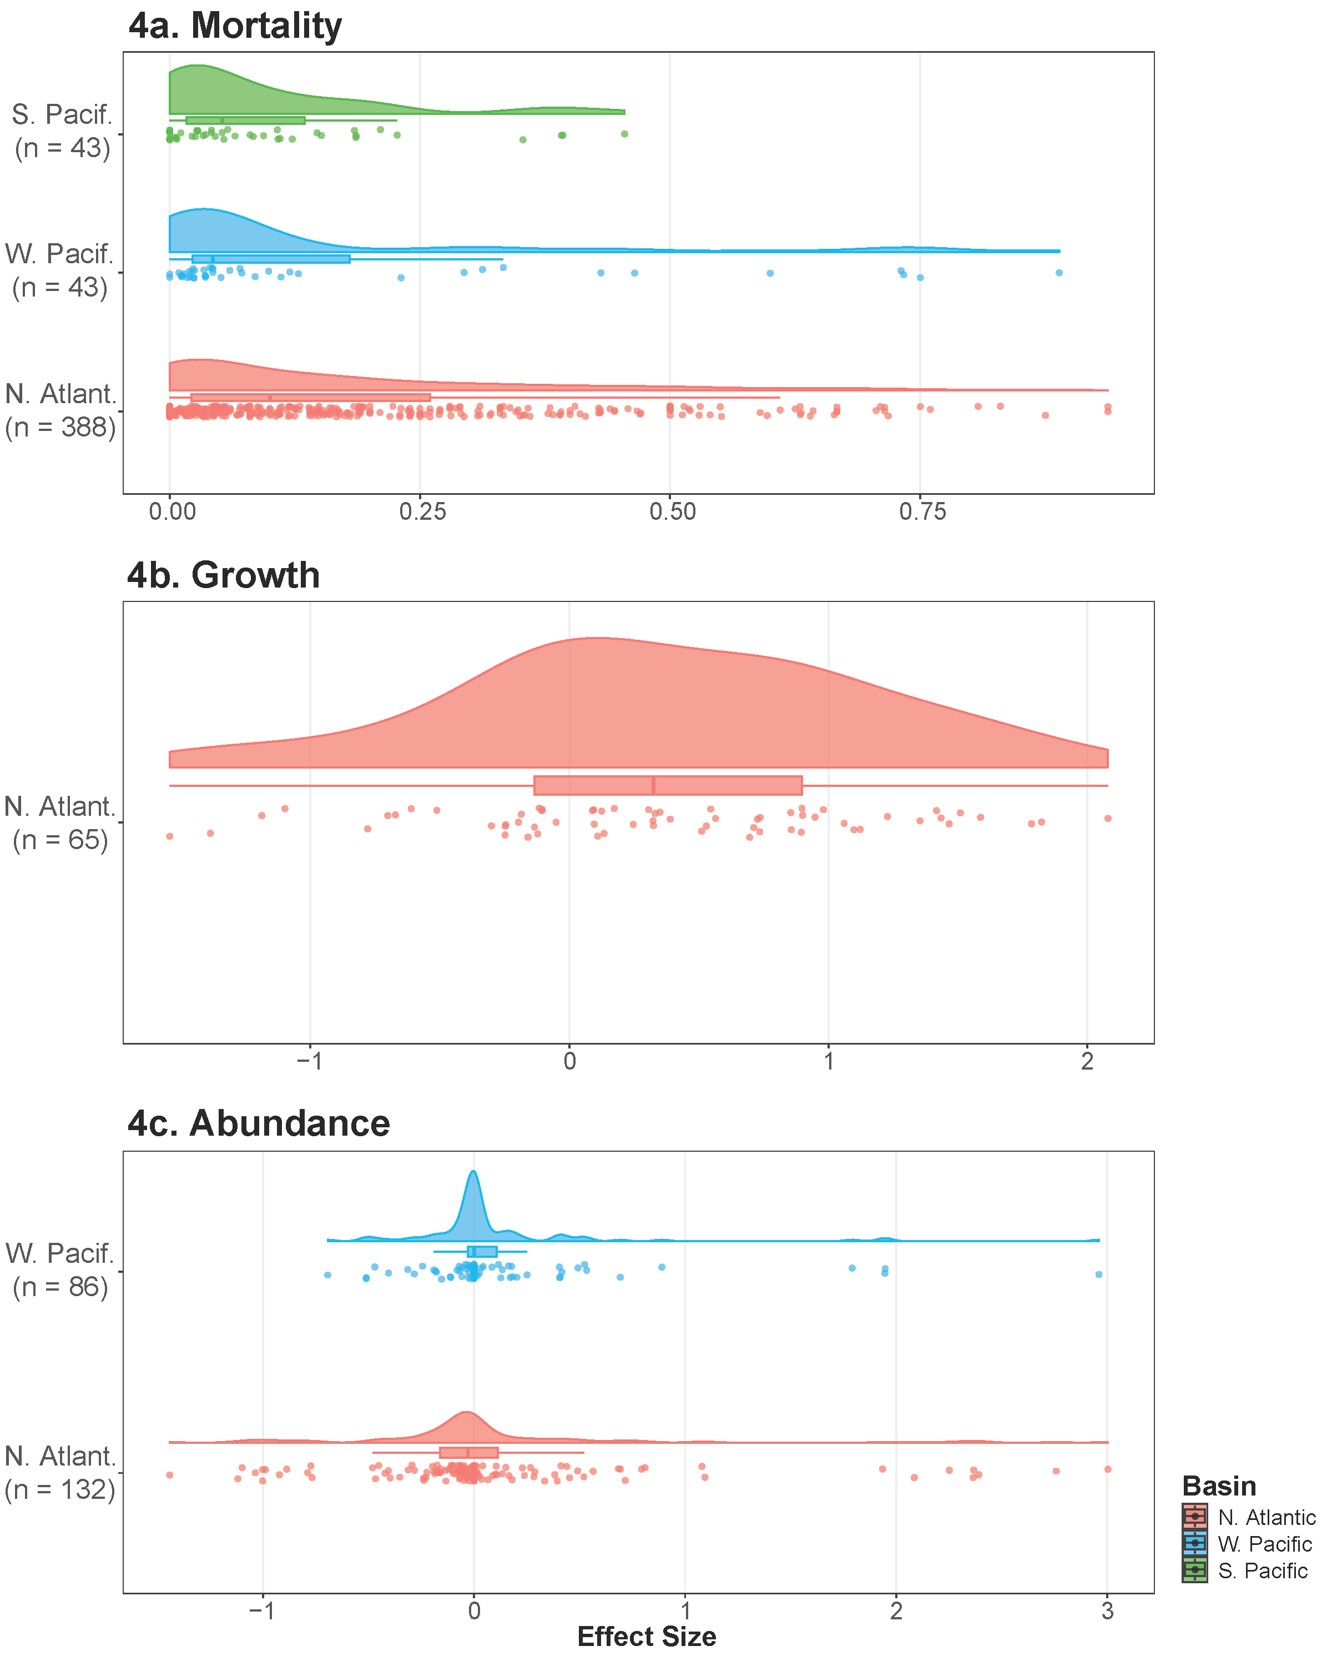
Figure 4: Raincloud plots for each demographic variable with density curves, boxplots, and jittered points. a) shows the mortality rate effect size outcomes for each represented basin, b) shows growth rate effect size, and c) shows the abundance change effect size. The sample size (n) for each basin and demographic variable category are provided along the left side of each graph
Researchers Involved:

Vanessa Mariano
IGCB Exchange Fellow

María Natalia Umaña
Assistant Professor, Ecology and Evolutionary Biology

Tomás Fuentes-Rohwer
2024 IGCB Graduate Fellow, PhD Student, Ecology and Evolutionary Biology
Updated August 2026